Data can help us understand the current state of an industry and give us a glimpse into where it’s headed.
The banking industry is always changing, with technological advances impacting how customers interact with banks and credit unions.
To give you an inside look into the trends shaping the world of consumer banking, we’ve compiled the top banking statistics from the Federal Reserve and other key data sources.
Fast Facts on the Banking Industry
- In 2022, the global commercial banking market hit $2.7 trillion, with an expected growth rate of 3% over the next year.
- The FDIC estimates that 4.5% of U.S. households are unbanked.
- 34% of consumers use mobile banking as their primary method of accessing their account, more than any other method.
- In 2022, there were 4,135 banks across the US.
- Chase has the most branches of any bank in the US, with more than 5,000 branches.
Snapshot of the U.S. Market
Before we dive into how people bank, here’s a big-picture look at the banking industry as a whole.
10 Largest U.S. Banks in 2026
In 2022, there were 4,135 banks insured by the FDIC.
Of those banks, the Federal Reserve reports the following as the largest banks in the country as of March 31, 2023, based on their consolidated assets.
| Bank Name | Assets |
| JP Morgan Chase | $3.27 trillion |
| Bank of America | $2.52 trillion |
| Citibank | $1.72 trillion |
| Wells Fargo | $1.69 trillion |
| U.S. Bancorp | $590.46 billion |
| Truist Bank | $564.84 billion |
| PNC Bank | $556.31 billion |
| Goldman Sachs | $490.79 billion |
| Capital One | $469.43 billion |
| TD Bank | $401.25 billion |
Total Assets of All U.S. Commercial Banks
The banking industry has experienced steady growth over the last decade. Today, the combined total asset value of all the banks in the US is $21.81 trillion.
Over the last three years, the industry has grown by $4.32 trillion, up from $17.49 trillion in 2019.
Number of Bank Branches in the US
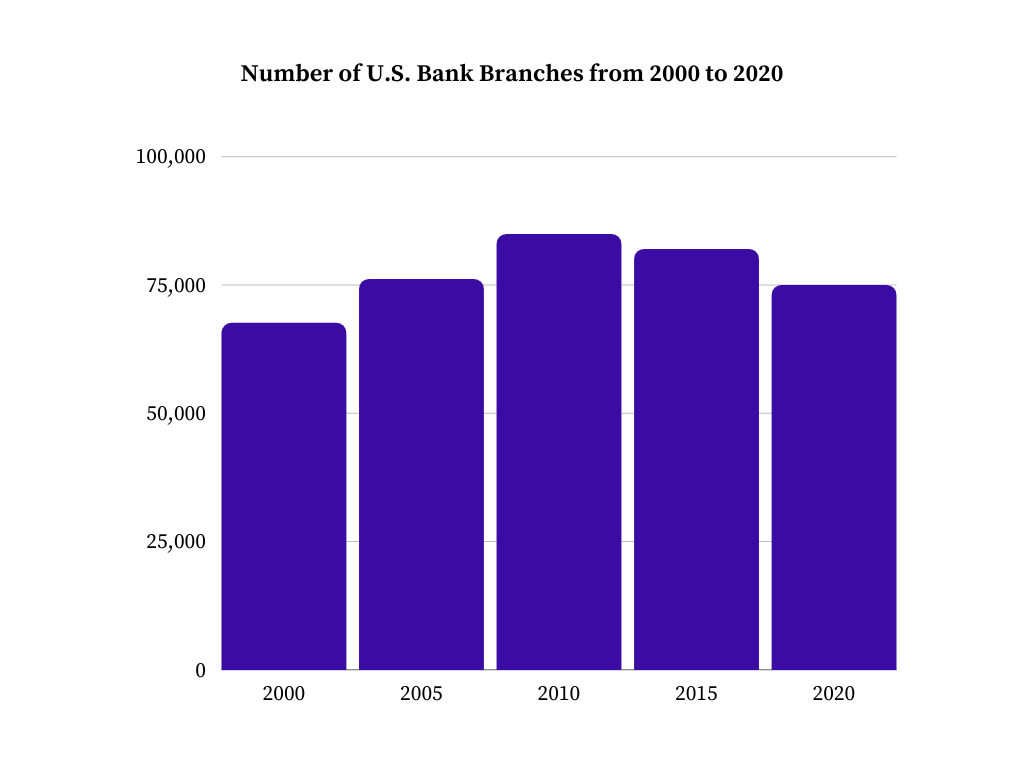
From 2000 to 2010, the number of bank branches across the nation steadily rose each year. The next decade saw a gradual decrease in physical bank branches as online banks became more popular. In 2020, there were 74,928 branches, down from 81,843 branches in 2015.
This decline grew sharper during the pandemic, with more and more banks closing down their physical locations. According to S&P Global Market Intelligence, 2,927 bank branches shuttered in 2021.
Bank Account Trends
As banks have changed over the years, so have their rates, fees, and account structures. Here’s a look into some of the biggest trends among consumer bank accounts in the US.
Most Popular Bank Accounts
Based on the Fed’s 2019 Survey of Consumer Finances, 98.7% of American families have at least one financial asset. The most popular, by a landslide, is a transactional account.
98.2% of American households have a transactional account, which is defined as a:
Another 7.7% own certificates of deposit, while 7.5% have savings bonds.
Average Checking Account Balance
According to the same report, the median checking account balance for Americans is $5,300.
Here’s what median account balances look like in each age group:
| Age | Median Account Balance |
| Under 35 years | $3,240 |
| 35-44 years | $4,710 |
| 45-54 years | $5,620 |
| 55-64 years | $6,400 |
| 65-74 years | $8,000 |
| 75 years and older | $9,300 |
Common Account Fees
Account fees can vary from bank to bank, so it’s important to read the fine print before you open a new account.
For instance, some banks let you close your account at any time for free, while others charge $25 if you close your account within 180 days of opening it.
The graph below highlights some of the most common bank account fees you might encounter. It features the highest fees you can expect to pay with most major banks.
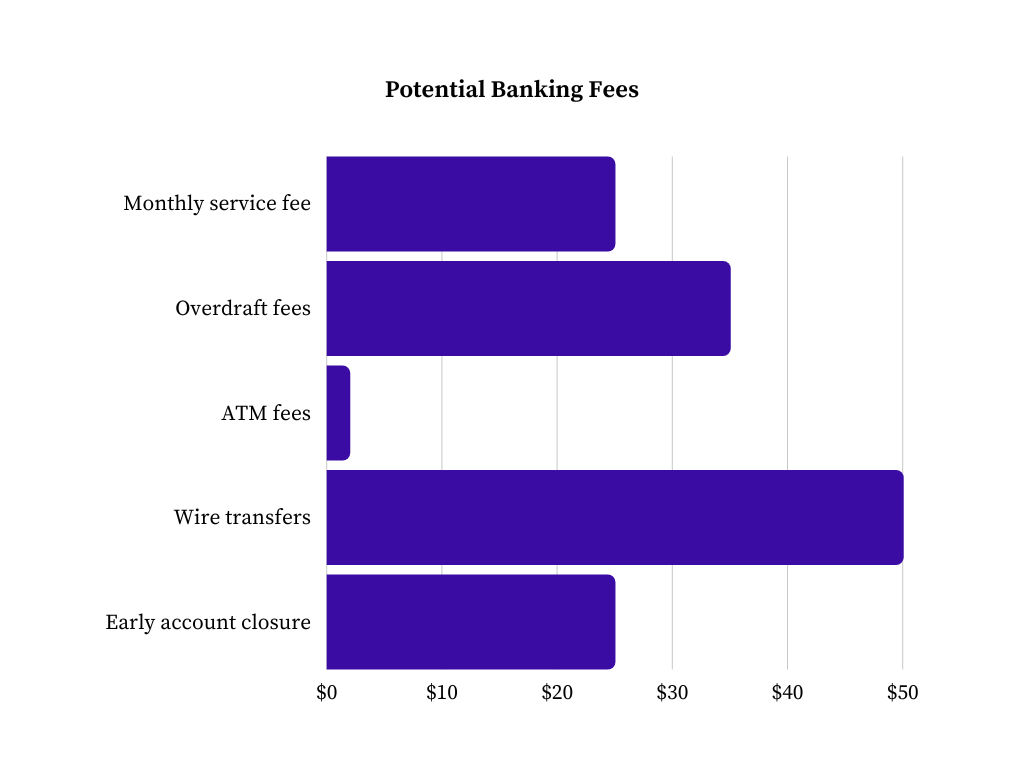
Whether or not you’re liable for these account fees depends on 2 factors:
- The Bank You Choose: Since digital banks don’t share all the overhead costs of their brick-and-mortar competitors, they can get by with far fewer fees. For instance, most don’t charge a monthly service fee.
- Your Account: Some accounts come with higher minimum requirements but offer more rewards, such as offering overdraft protection and reimbursing ATM fees.
Average Interest Rates
Effective June of 2023, the Federal Reserve raised the federal funds rate to 5.08% in an attempt to offset inflation.
While these rate hikes might hurt borrowers, they can benefit high-yield savings accounts and CDs, leading to increased APY.
Here’s a current snapshot of the national average interest rate for different bank accounts according to FDIC data from July of 2023.
| Account | Average APY |
| High-Yield Savings | 0.42% |
| Interest-Bearing Checking | 0.07% |
| Money Market | 0.63% |
| 1 Month CD | 0.20% |
| 3 Month CD | 1.11% |
| 6 Month CD | 1.30% |
| 12 Month CD | 1.72% |
| 24 Month CD | 1.47% |
| 36 Month CD | 1.37% |
| 48 Month CD | 1.30% |
| 60 Month CD | 1.37% |
How People Bank
Without a doubt, the biggest change in the banking industry in recent years is tied to technology. The way consumers prefer to bank, shop, and make payments is always evolving, and you can see it in the numbers below.
Take a look at how digital banking is reshaping the industry.
The Rise of Mobile Banking
The FDIC’s How America Banks survey gives a ton of valuable insight into American consumers’ banking preferences and how they’ve changed in recent years.
One of the most interesting findings is the major uptick in mobile banking. As you can see in the graph below, mobile banking toppled online banking as most consumers’ go-to banking method in 2019, the most recent year the survey was conducted.
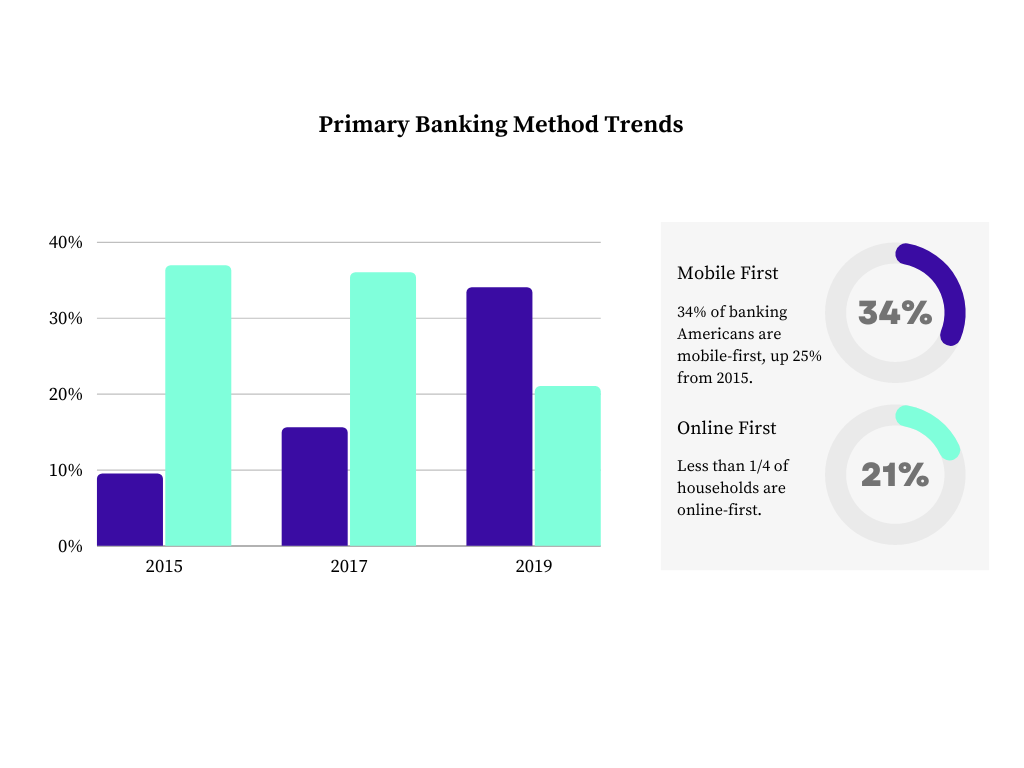
More than half of consumers use their phones or computers as their first line of managing their bank accounts, which makes sense.
Online banks in particular have honed in on creating user-friendly mobile banking apps and websites with tools and resources to help customers bank on the go with ease.
Mobile Banking and Age
It shouldn’t come as a surprise that the youngest respondents to the Fed’s 2016 Consumer and Mobile Financial Services survey were most likely to adopt mobile banking.
Here’s a quick comparison of mobile banking usage by age group in 2011 and 2015.
| Age Group | 2011 | 2015 |
| 18-29 years | 45% | 67% |
| 30-44 years | 29% | 58% |
| 45-59 years | 12% | 34% |
| 60 and older | 5% | 18% |
18-29-year-olds were the earliest adopters, but there was also a marked increase in mobile banking across each age group over time, with the most significant jump happening amongst 30-44 and 45-59-year-olds.
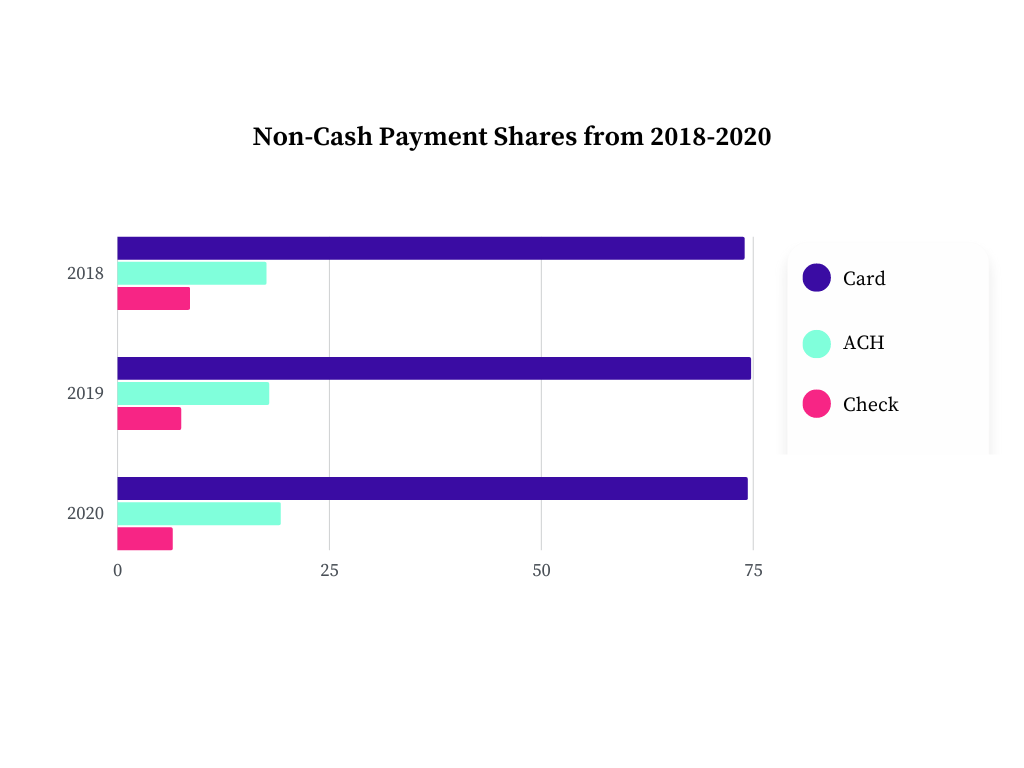
Consumer Payment Trends
The Federal Reserve Payment Study takes an in-depth look at all the processed payments in the US, breaking down the shares of non-cash payment methods.
The data below shows that consumers consistently relied on card payments over the last few years, with an uptick in ACH bank-to-bank payments and a decrease in checks.
Why Consumers Do and Don’t Prefer Mobile Payments
According to Federal Reserve data, these are the biggest reasons consumers started making mobile payments:
- Convenience
- Accessibility from smartphone
- Having the ability to make more mobile payments
- Becoming more comfortable with the security of mobile pay
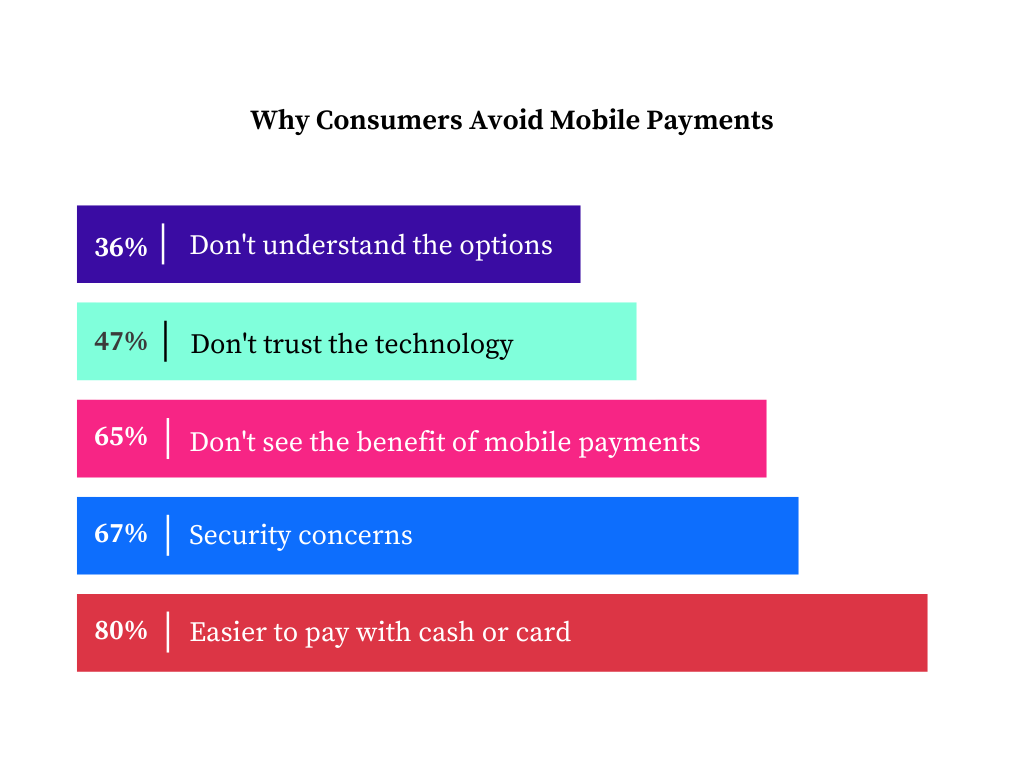
On the other hand, the table below demonstrates the top 5 reasons consumers cited for avoiding mobile payments:
Alternative Financial Transactions
According to the FDIC Household Survey, a percentage of both banked and non-banked households turn to financial transaction services beyond debit and credit cards, checks, and ACH transfers.
Here’s the breakdown from 2019:
- Prepaid Cards: 5% of households used prepaid cards, with the most popularity among lower income, less educated, and younger individuals. For reference, 27.7% of unbanked households used a prepaid card in 2019, compared to 7.7% of banked households.
- Money Orders: 9% of households surveyed used money orders in 2019, falling 2.3% from 2017.
- Check Cashing: 5% of households used check cashing services within the last 12 months, down .70% from 2017.
- Bill Payment Services: 9% of households used bill payment services in 2019, predominantly younger, low-income, and less educated households.
Unbanked Household Data
Not everyone has access to a bank account. Each year, a percentage of Americans remains unbanked or underbanked.
The stats below shed some light on the factors at play and highlight trends among the unbanked populations of the United States.
Who Makes Up the Unbanked Population?
According to the FDIC, approximately 4.5% of U.S. households qualify as unbanked. Unbanked households are defined as homes in which no one has a checking or savings account.
This is a solid improvement from a decade ago. In 2011, 8.2% of U.S. households were unbanked.
The FDIC reports that unbanked rates are higher among the following demographics:
- Black households
- Hispanic households
- Native American households
- Lower-income households
- Less-educated households
- Households with volatile income
- Working-aged disabled households
Unbanked Rates by Age Group
Based on the figures below and trends in the Fed’s historical data, banking status may also be tied to age.
Over the last several years, the highest volume of unbanked individuals has fallen into the 15-24-year-old category.
However, the number of unbanked 15-24-year-olds declined by more than 4% between 2015 and 2019.
| Age Group | Percentage of Unbanked Population |
| 15-24 years | 8.8% |
| 25-34 years | 6.9% |
| 35-44 years | 6.3% |
| 45-54 years | 5.1% |
| 55-64 years | 5.5% |
| 65 and older | 3.3% |
Unbanked Rates by Income Level
| Household Income | Percentage of Unbanked Population |
| Less than $15,000 | 23.3% |
| $15,000-$30,000 | 10.4% |
| $30,000-$50,000 | 4.6% |
| $50,000-$75,000 | 1.7% |
| $75,000 or more | 0.6% |
This data shows a clear correlation between income level and banking, with one-third of the unbanked in the US comprised of individuals earning $30,000 or less per year.
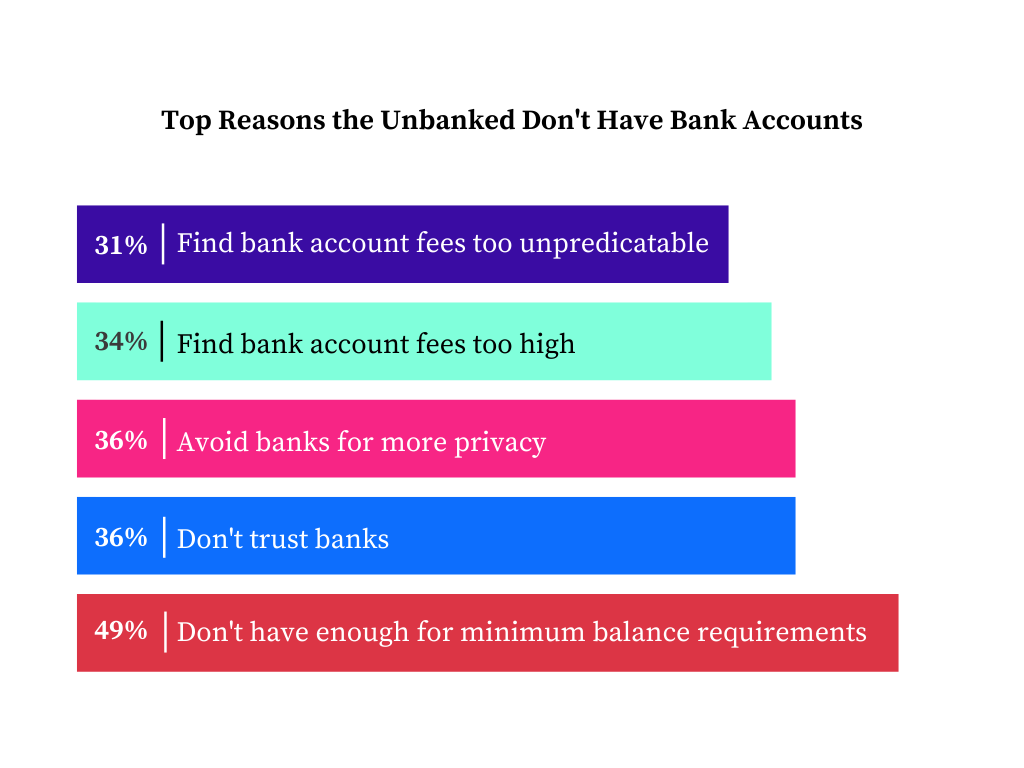
Why the Unbanked Don’t Have Bank Accounts
There’s a long list of reasons why people don’t have bank accounts. Here are the top five reasons cited by unbanked households in the FDIC survey.
Resources:
- How America Banks Survey, FDIC
- Largest Commercial Banks, Federal Reserve
- S&P Market Intelligence
- Survey of Consumer Finances, Federal Reserve
- FDIC-insured Commercial Bank Branches in the U.S. 2000-2021, Statista
- Consumers and Mobile Financial Services 2016, Federal Reserve
- Federal Reserve Payments Study, Federal Reserve
- National Rates and Rate Caps, FDIC
- Effective Federal Funds Rate, FDIC
Comments are closed.
Comments are closed here.